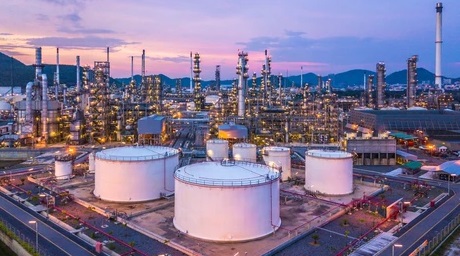
This report casts a historical narrative of the very important but rarely discussed global refining M&A activity as revealed by such metrics as deal count, deal value, quantum of refining capacity up for M&A and the accompanying segregation by region, and deal category.
The database of refinery M&A is from year 2000 to 2016 contains 244 refinery M&A deals captured out of which there are 96 deals. These 96 deals have a refinery consideration value that totals $49.27 billion (RT2016) over the period.
Refining Deal Value is log-normally distributed with ~75% of value less than $500 million (RT2016). At the same time, the Nelson Complexity Index of the transacted refineries shows a normal distribution with an average of 7.52.

On the ownership structure of refineries, an estimated 19% of all 754 captured operational refineries globally are co-owned. Of these co-owned refineries, 43% are in Asia Pacific, while 14% in Europe, 10% in North America and Africa.
Regression analysis captures the impact of the drivers of refinery deal value. Analysis shows that a 10% increase in deal capacity results in a 9.98% increase in refining asset deal value. In comparison, a 10% increase in the complexity index results in a 9.10% increase in refining asset value.
The regression results also reveal that the transaction value where both entities are private tends to be lower than any other Seller – Buyer Pair. It is also shown that oil price in the year of the deal is not statistically significant to explain the deal count and its corresponding value.
